Macro research
Macro investing: rates, inflation and growth
Connect macro news to a company’s demand, margins, financing and valuation. A practical framework for reading economic releases alongside stock analysis.
Macro changes the assumptions around a company
A strong business still operates inside an economy. Demand affects sales, input costs affect margins, financing affects cash available to shareholders, and discount rates affect how future cash flows are valued. Macro analysis is useful when it identifies which of these assumptions changed. It is much less useful as a one-word “bullish” or “bearish” verdict attached to every headline. Begin with the company’s actual exposures, not a universal rule for all stocks.
Rates have more than one channel
The Federal Reserve describes monetary policy as influencing financial conditions and the decisions of households and businesses. For stock research, separate the discount-rate channel from the business channel: higher borrowing costs can reduce demand or raise interest expense, while lower rates may accompany weakening activity. The policy rate and a company’s borrowing rate are not the same number. Credit spreads, maturity and fixed-versus-floating debt matter. Federal Reserve: how monetary policy works
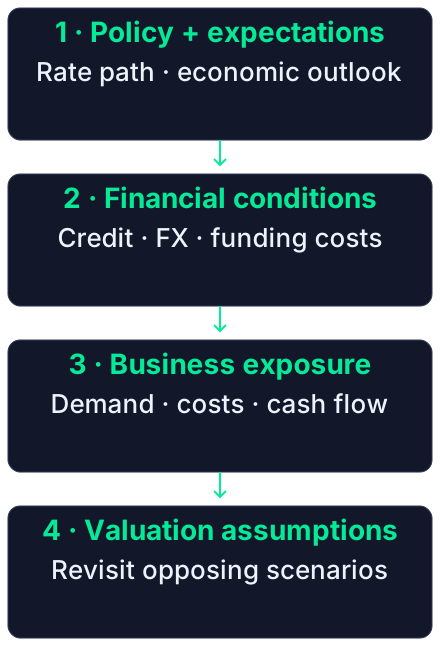
Read the diagram as text
- 1 · Policy + expectations: Rate path · economic outlook
- 2 · Financial conditions: Credit · FX · funding costs
- 3 · Business exposure: Demand · costs · cash flow
- 4 · Valuation assumptions: Revisit opposing scenarios
A valuation example without a stock-price forecast
Suppose a fictional asset pays exactly $100 ten years from now and nothing before that. Discounting at 5% gives $100 / 1.05^10, about $61.39; at 7% it gives about $50.83. This arithmetic holds the payment fixed and changes only the rate. Real companies have uncertain cash flows and changing risk premia, so it is not a forecast that a growth stock must fall by the same percentage. Use it to identify which assumption drives a valuation argument.
Inflation and growth are different measurements
CPI measures changes in consumer prices; it does not measure a particular company’s input basket or profit margin. Label the observation month, monthly versus annual comparison, and seasonal adjustment before comparing releases. Then investigate the company’s pricing power, supply contracts and customer demand. A lower inflation rate still means prices are rising when the rate remains positive. Slower price growth and falling prices are different states. BLS: Consumer Price Index overview
Build scenarios tied to the business
For an illustrative manufacturer, compare energy costs, wage expense and order volume rather than treating an oil headline as a complete earnings model. For a business valued mainly on distant profits, examine how both growth expectations and discount rates change. For an exporter, examine revenue currency and hedging rather than assuming every dollar move has the same effect. These are research questions, not fixed sector buy/sell rules. Record what observation would contradict each scenario.
Use GSDAQ to keep the context visible
Combine the economic calendar with available rate, volatility, breadth and sector widgets, then open the relevant company news. Ask AI which statements are release facts and which are interpretations. The calendar’s event time, the data period and GSDAQ’s refresh time can differ. A macro dashboard and historical-pattern chart overlay do not establish that a model has incorporated a newly released statistic. Read the dated briefing linked below for an example of keeping those boundaries explicit.
Apply the method to news: the September 11 CPI release
BLS published its August 2026 CPI release on September 11. Separate the seasonally adjusted monthly change from the unadjusted annual comparison, then write questions about business costs, demand and pricing power. This is a dated example, not a claim that it is the newest release whenever you read the guide. CPI alone does not establish the next rate decision or stock-price direction. BLS: August 2026 CPI release · published September 11